
 |
| From DYJS Graphics |
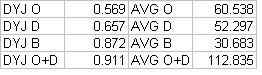
The first set of values is the correlation coefficient, or "r." A value of r that is greater than zero means a positive correlation (as wins go up, DYJS also goes up). Based on my knowledge of similar studies, r-values of greater than 0.35 are considered significant. For comparison, the correlation of Runs Scored to wins in 2006 was r = 0.65. So DYJS continues to have excellent correlation to regular season winning percentage . For a more graphical view of the above, consult the following graphics:
 |
| From DYJS Graphics |
 |
| From DYJS Graphics |
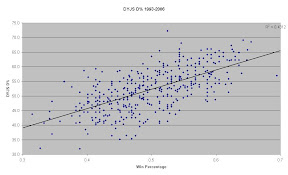
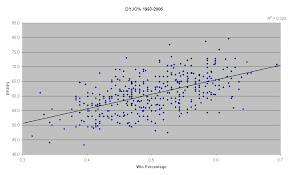
While in the statistical realm such a graph might be referred to as "Shotgun," I believe that the trendline is real and is significant, particularly for pitching. One direction this analysis could take would be to identify some of the extreme outliers and examine these potentially interesting teams. For example, the 1993 Atlanta Braves had an unusually low DYJO% of 55.6%. Yet they won 104 games. Why? Because Greg Maddux, John Smoltz, and Tom Glavine led an extraordinary pitching staff to a DYJD% of 69.1%, second overall in our entire data set.
A primary goal of creating any statistic is to make top 10 lists for your new stat. So here we go, the top 10 teams in all four statistics since 1993:
One thing that kind of jumps out is the high percentage of teams from 1994 that appear on this list. The strike-shortened season did indeed produce two teams with winning percentages greater than .700 (Expos and Yankees), but I cannot be sure whether there was not some effect from not playing games in September (For example, do the "callups" who frequently play in September Get the Job Done less frequently?). I will answer this and other questions in future posts. I would also like to adjust for the year, since the number of runs scored in 1993 is not the same as in 2006; nor is the average DYJS, I'm guessing. I will also try to normalize for home park factors, as suggested by poster Kiffy in the last DYJS post.
Finally, we're working on making the data more flexible, so that we can play with the measure of Doing Your Job. As a poster at WasWatching pointed out:
in reality, the yanks would have to score more than the leage average in runs
per game, and allow less than that. as far as i can tell, the average number of
runs per team per game, last year was 4.857. so when doing this analysis it is
important to remember that when the offense score 5, it is less valuable to the
team than when the pitching/defense allows 4. also it is easy to say the
pitching didn't do their part, because it is easy for the offense to score the
extra ~0.14 runs, as opposed to the offense preventing the extra ~0.84 runs.
This does make sense, and we are hoping to bring more data into the fold that can measure DYJS with a score of 5 or 3, or whatever we wish. Finally, because I'm a Yankees fan, here's a look at how the Yanks have performed in DYJS since 1993 (maybe I'll add more teams later). The teams are arranged by their DYJ O+D score:


No comments:
Post a Comment